 SNAP GeoNetwork
20 km
Type of resources
Topics
Keywords
Contact for the resource
Provided by
Years
Formats
Representation types
Update frequencies
status
Resolution
-
This dataset consists of four different sub-datasets: degree days below 65°F (or "heating degree days"), degree days below 0°F, degree days below 32°F (or "freezing index"), and degree days above 32°F (or "thawing index"). All were derived from the same dataset of outputs from dynamically downscaling one reanalysis (ERA-Interim) and two CMIP5 GCMs (GFDL-CM3, NCAR-CCSM4) over Alaska using the Weather Research and Forecasting model (WRF). Data from the GCMs are driven exclusively by the RCP 8.5 emissions scenario. Heating degree days, degree days below 0°F, and freezing index were computed in the following way: subtract the daily mean temperature values from the threshold value and compute the sum of this time series for the given calendar year. Thawing index is instead computed as the annual sum of the quantities resulting from subtracting the threshold (32°F) from the daily mean temperature values.
-

Rain on snow (ROS) events were derived from 20km dynamically downscaled ERA-Interim reanalysis and global climate model (GCM) climate projections data. The GCM data were from RCP 8.5 of GFDL-CM3 and NCAR-CCSM4. The amount of liquid precipitation for each day is provided in the database for each grid cell and was determined to be a ROS event by the temperature being at or near freezing and/or the presence of snow on the ground.
-
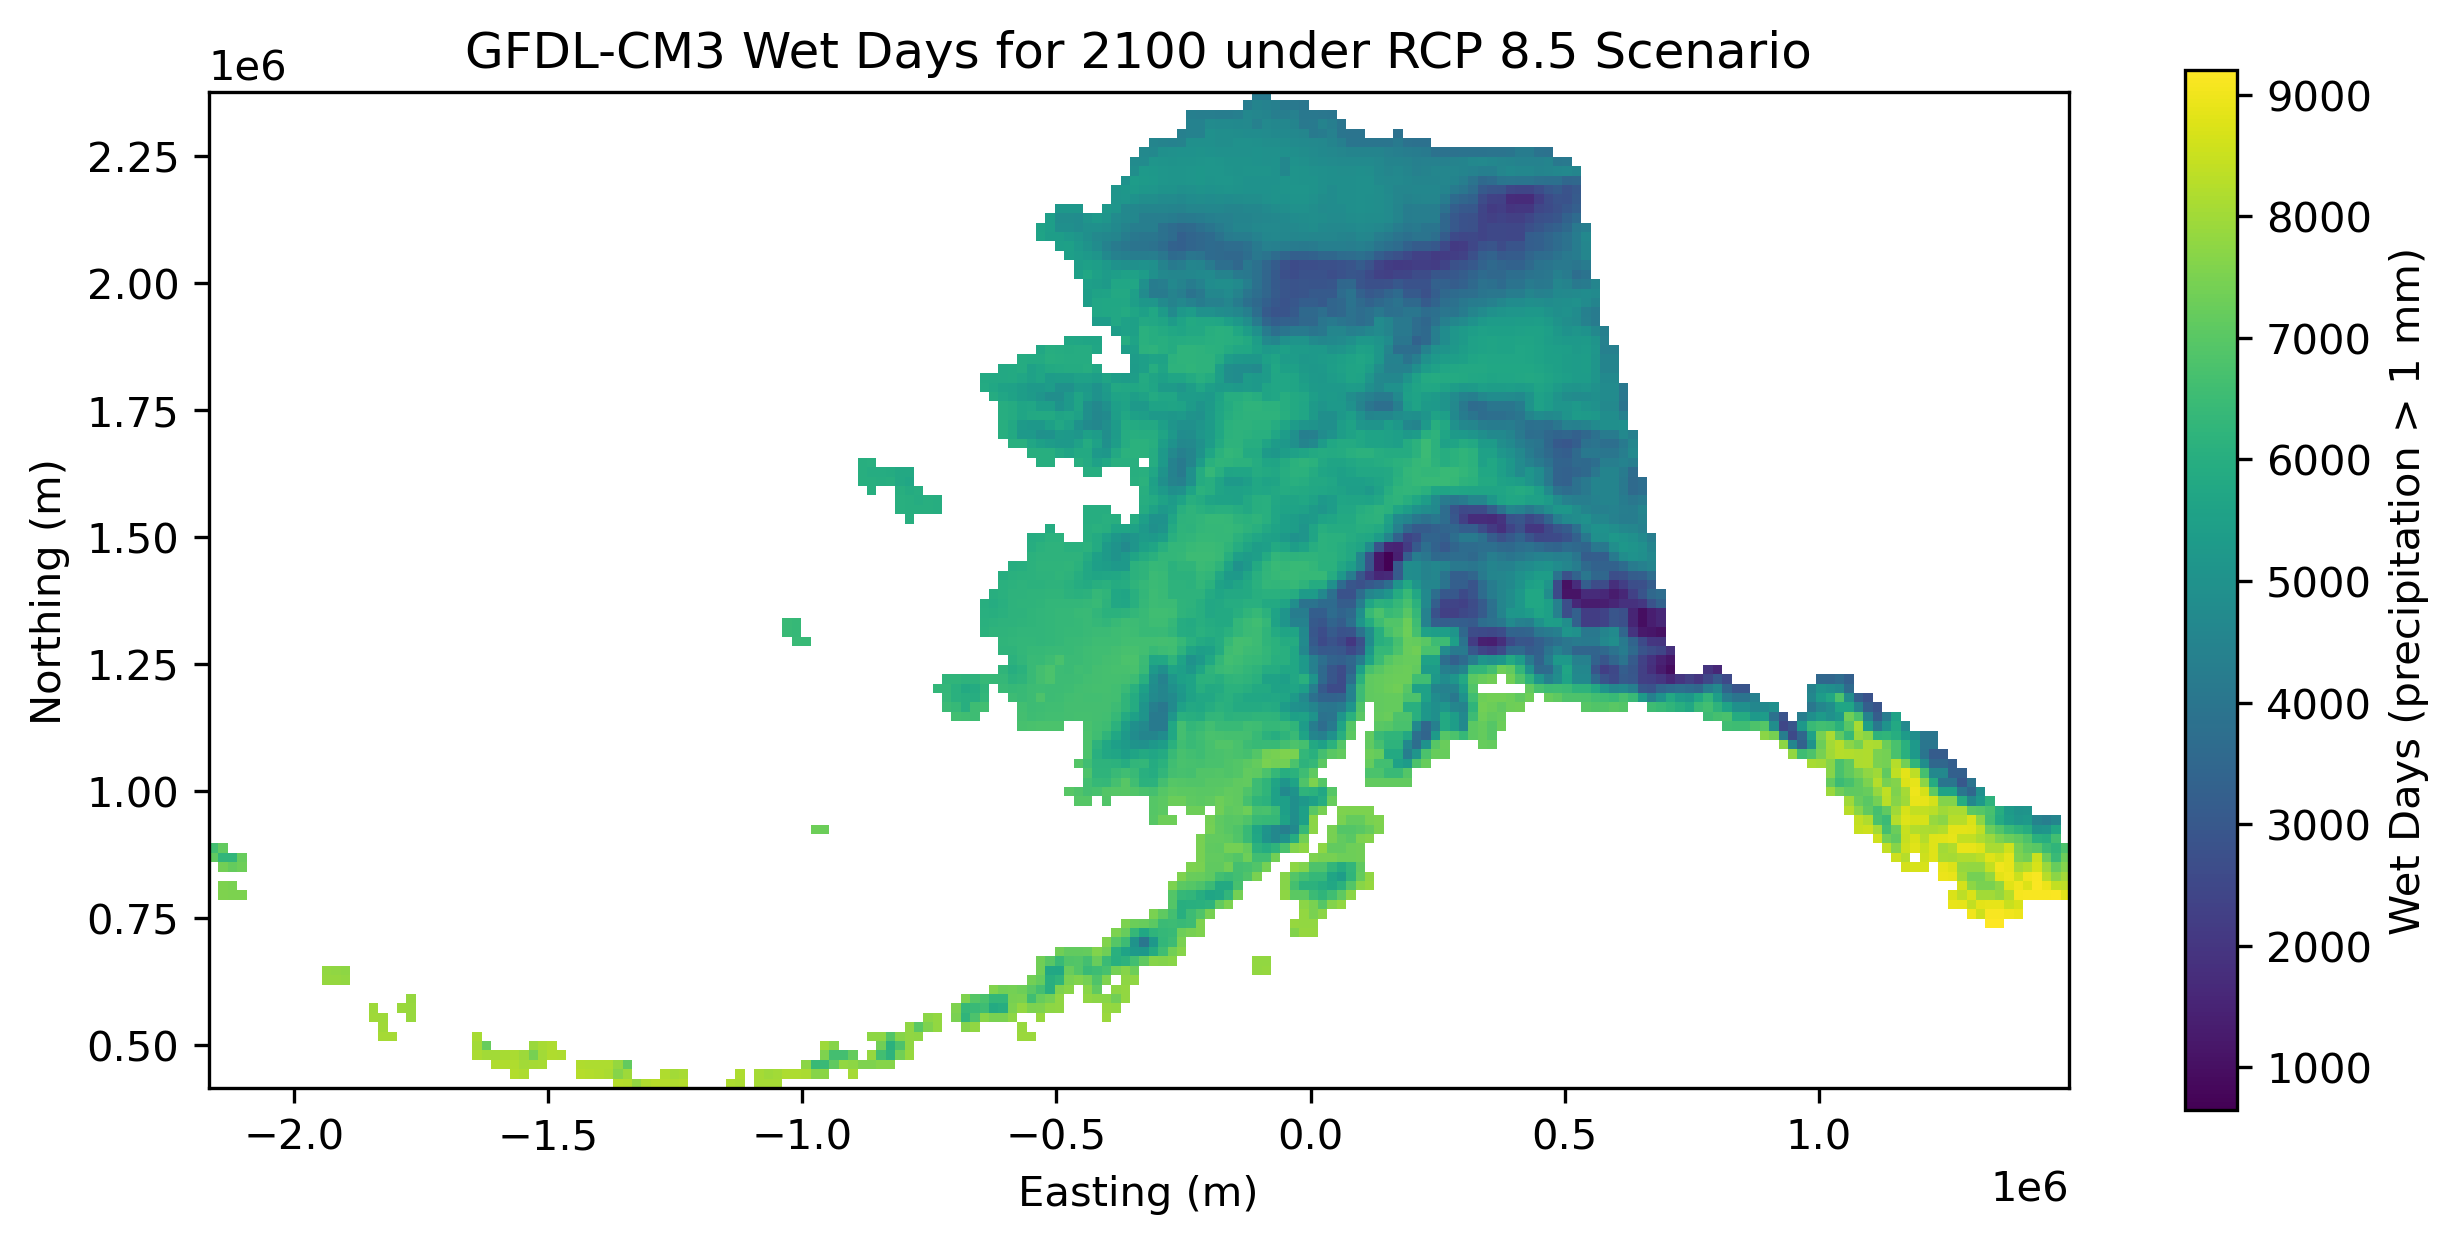
This dataset consists of single band GeoTIFFs containing total annual counts of wet days for each year from 1980-2100 for one downscaled reanalysis (ERA-Interim, 1980-2015) and two downscaled CMIP5 global climate models driven under the RCP 8.5 baseline emissions scenario (NCAR-CCSM4 and GFDL-CM3, 2006-2100), all derived from the same dynamical downscaling effort using the Weather Research and Forecasting (WRF) model (Version 3.5). A day is counted as a "wet day" if the total precipitation for that day is 1 mm or greater.
-
This dataset contains historical and projected dynamically downscaled climate data for the State of Alaska and surrounding regions at 20km spatial resolution and hourly temporal resolution. Select variables are also summarized into daily resolutions. This data was produced using the Weather Research and Forecasting (WRF) model (Version 3.5). We downscaled both ERA-Interim historical reanalysis data (1979 - Oct 2015) and both historical and projected runs from 2 GCM’s from the Coupled Model Inter-comparison Project 5 (CMIP5): GFDL-CM3 and NCAR-CCSM4 (historical run: 1970-2005 and RCP 8.5: 2006-2100). This dataset was updated to a version 1.1 in August, 2023 to retain useful fields of latitude and longitude geolocation grids from the WRF model. The original version is available upon request.